The H-1B season is in full swing in the United States, with numerous individuals worldwide competing for the highly sought-after work visa. The current annual regular cap for the H-1B category, set by the US Congress, is 65,000.
An H-1B temporary worker is typically a non-citizen who enters the United States to perform services in a specialized occupation. American employers submit H-1B petitions on behalf of the employees they have hired, and recipients are selected through a lottery system.
The total number of H-1B petitions filed saw a 19.1% increase, rising from 398,296 in FY21 to 474,301 in FY22. Out of these, the number of approved petitions increased by 8.6% from 407,071 in FY21 to 442,043 in FY22. (Source – The Economic Times)
According to a report by the US Citizenship and Immigration Services (USCIS), 72.6% of H-1B applications received from India in FY22 were accepted.
It’s important to keep in mind that the H-1B program is distinct from the US citizenship by investment program, which enables people to become US citizens by meeting certain financial requirements.
Here is a breakdown of the total applicants from 2022:
First-time applicants vs. continuing employees:
In FY22, there were more petitions filed for both initial employment and continuing employment compared to the previous four years.

Source – The Economic Times
In FY22, the USCIS approved 442,043 H-1B petitions, which surpassed the numbers of the previous four years. Among these, 132,429 petitions for initial employment were approved, marking the highest number in the past four years, except for 2019.
The USCIS approved 309,614 petitions for continuing employment in FY22, which was the highest number in the past four fiscal years.
Approved petitions for initial employment included petitions for new employment (30%) and new concurrent employment (<1%).
Petitions for continuing employment included requests for extensions (20.4%), amendments (21.6%), and sequential employment (change of employer, 28%).
Men vs. women:
Men accounted for the majority (70.8%) of all approved H-1B petitions, while women accounted for 29%.
Women had a larger share (35.6%) of approved initial employment petitions compared to their share of continuing employment (26.2%).
While men outnumbered women in every education category, a higher percentage of women held a master’s, doctorate, or professional degree compared to their male counterparts.
In the case of India, 76% of the total recipients were male, while 24% were female.
Age factor:
The median age of approved H-1B beneficiaries in FY22 was 33 years old.
Among beneficiaries approved for initial employment, nearly two-thirds (65%) were between 25 and 34 years old.
Beneficiaries approved for continuing employment were slightly older, with almost two-thirds (62.8%) falling between 30 and 39 years old.

Source – The Economic Times
Level of education:
Regarding qualifications, 31.7% of beneficiaries with an approved H-1B petition in FY22 held a bachelor’s degree.
Additionally, 31.1% were workers with a master’s degree, 7.6% possessed a doctorate, and 3.1% had a professional degree.
A higher percentage of beneficiaries approved for initial employment had earned a doctorate (12.5%) or professional degree (4.3%) compared to those in continuing employment (5.5% and 2.6%, respectively).

Source – The Economic Times
Occupation:
In FY22, the professional, scientific, and technical services sector was the most common industry sector among employers of H-1B workers, accounting for 46.2% of all approved petitions.

Source – The Economic Times
Computer-related occupations constituted the largest major occupational category, representing 66% of all beneficiaries.
The largest detailed occupational group was systems analysis and programming, making up 54.7% of all beneficiaries and falling within the major occupational category of computer-related occupations.
The second-largest major occupational group was architecture, engineering, and surveying, accounting for 9.8%.
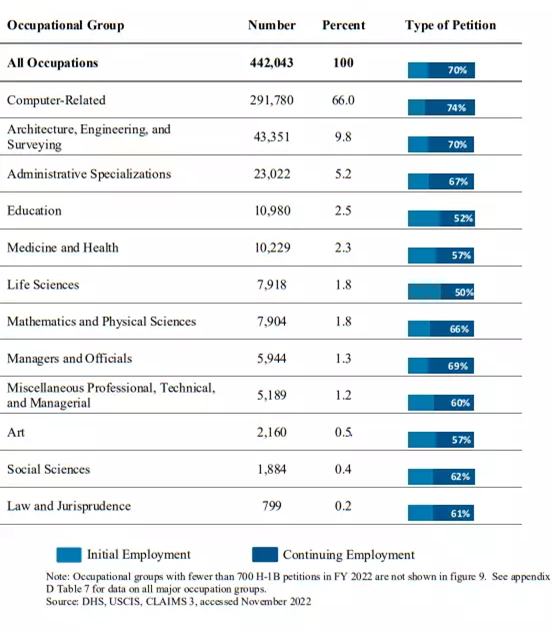
Source – The Economic Times
Conclusion
In summary, the H-1B program in the United States experienced a significant increase in petitions filed and approved in FY22. Men accounted for the majority of approved petitions, while women had a higher share of initial employment approvals. The median age of beneficiaries was 33 years old, and a significant percentage held bachelor’s or master’s degrees. The professional, scientific, and technical services sector was the most common industry, with computer-related occupations being the largest category.
For individuals interested in US citizenship or residency through investment, My Global Citizenship is a trusted immigration consulting firm. In addition to offering a truly global perspective on citizenship and residency by investment, we have extensive knowledge of these programs. In addition to providing comprehensive services, we also assist our clients in selecting and applying for a second citizenship or residency. We also assist them in obtaining final approval for their second citizenship. We provide expert assistance and support at every stage of the process, ensuring a seamless transition.
If you still have any queries, connect with our team, and we will be more than happy to assist.